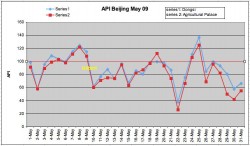
The table for May 2009 is done! Shows the pollution in Beijing.
I now included a second measuring point, the Agricultural Exhibition Palace.
For further details, see the related Pages in the right hand column of this blog – more general information on API, pollution effects, charts etc. All completely re-designed!
