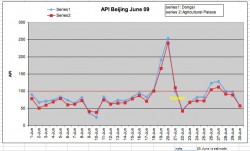
Here it is, my table for June 2009. Only one date I missed. Again, the same two locations.
Interesting is to note that the 2nd location, Agricultural Palace, is pretty close to the U.S. Embassy who has now its own monitoring station with a focus on PM2.5. So, the argument of China Daily and other Chinese “specialists” that the Embassy’s reading is in a (more) polluted zone being CBD does not make any sense. As one can see in my table, Dongsi is overall worse and there are still worse locations. Also, “CBD”? grab a map folks. CBD is several subway stations to the south!
More about the Embassy readings later (available on Twitter only). Yes, PM2.5 is very bad and my lungs are full with it. Our Chinese goons here don’t like it at all that the Embassy and others indicate how bad Beijing really is. Promptly all website links reporting on the bad air are blocked. Call it “Green Dam”. Keep the citizens in the dark.
Even when Beijing says the air is “good”, you better stay inside, switch on a good air filtering machine and refrain from heavy exercise.
Just an illustration: in the night pollution is generally bad as the trucks run (wildly) around. On 2 June 23:00 Embassy reports EPA AQI (Environmental Protection Agency Air Quality Index) of 157 “unhealthy”. Average of the day: 141 (unhealthy for sensitive groups). Compare that to Beijing official figure of API 56. The periods do not correspond completely but the difference is too large.
More to come, check the Pages on the right.
